Products
- Google Earth Visualisation
- PSMSL Data Coverage
- GLOSS Station Handbook
- Mean Sea Level Anomalies
- Derived Trends
- Sea Level Reconstructions
- Commentaries
- Author Archive
- GLOSS-Related Information
Donate
Donate to PSMSL
Trends
Explore the Dataset
Click on globe to browse dataset in Google Earth
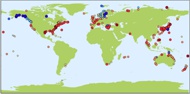
Click on map to browse sea level anomalies
Extracted from Database
Relative Sea Level Trends
Please note that we changed the method of calculating relative sea level trends in 2015. The trends displayed here are not directly comparable with any calculated before that date. For a description of how the trends are now calculated, please see the methods page.
This map allows interactive investigation of global mean sea level trends since 1900. Select the limits of the period you wish to view by either moving the buttons on the slider or by entering the values in the two text boxes. A period of at least thirty years must be selected. The map will display the annual sea level trend at each station that has suitable data available over the selected period. Further information is available on the methods page.
Note that these measured trends are not corrected for local land movement. Furthermore, no attempt has been made to assess the validity of any individual fit, so results should not be treated as a publication quality values suitable for use in planning or policy making.
| < -4 | < -2 | < -1 | < -0.5 | -0.5 to +0.5 | > +0.5 | > +1 | > +2 | > +4 | ||
| Trend, mm/yr | ||||||||||
The map should be used with some care as anomalous trends have many causes:
- land movements (e.g. earthquakes, glacial isostatic adjustment)
- unexplained instrumental datum shifts
- changes in atmospheric pressure
- short records
A more complete account can be found in geophysical signals. If a particular site is of interest, please obtain a complete time series plot along with the brief documentation and data files from the obtaining data page.
As part of the procedure we also estimate the seasonal cycle at each site, and produce an estimate of the length of series required to provide a given level of uncertainty in the trend estimate.
A table of long term trends derived from monthly mean values of sea level in the PSMSL RLR data set demonstrates the rate of change of sea level at each station. This is also available in a legacy text format.

![]()
![]()
![]()