Products
- Google Earth Visualisation
- PSMSL Data Coverage
- GLOSS Station Handbook
- Mean Sea Level Anomalies
- Derived Trends
- Sea Level Reconstructions
- Commentaries
- Author Archive
- GLOSS-Related Information
Donate
Donate to PSMSL
Explore the Dataset
Click on globe to browse dataset in Google Earth
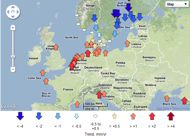
Click on map to browse sea level trends
Extracted from Database
Mean Sea Level Anomalies
Annual mean sea level can vary considerably from year to year in response to various meteorological and oceanographic forcings, typically by hundreds of millimetres. The product below allows you to examine the global variations in a year of your choice: select this year using either the slider or the text box. The map presents the difference between the annual RLR data for each station (which is quality and datum controlled) compared to that station's long term mean over the baseline period of 1960-1990. (Please see methods page.)
The long term trend at each station (estimated using the baseline period) can be removed by clicking the tick box. This will prevent results being dominated by long term changes, but will result in the loss of stations for which there is not enough data to calculate a trend. (See the derived trends page for more information.)
| Year: |
| Remove trend: |

![]()
![]()
![]()