Data
- Obtaining
- Supplying
- High-Frequency
- Bottom Pressure Records
- Other Long Records
- GLOSS/ODINAFRICA Calibration Data
Donate
Donate to PSMSL
Data Notes
- Individual Station Data and Plot Notes
- Referencing the Data Set
- PSMSL Help File
- 2010 Changes to the PSMSL Data Files
Extracted from Database
11 Mar 2024
Station Information
| Station ID: | 820 |
| Latitude: | -33.951111 |
| Longitude: | 25.629722 |
| GLOSS ID: | 76 |
| Coastline code: | 430 |
| Station code: | 88 |
| Country: | SOUTH AFRICA |
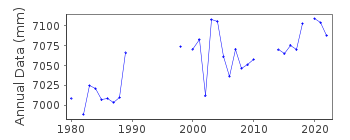
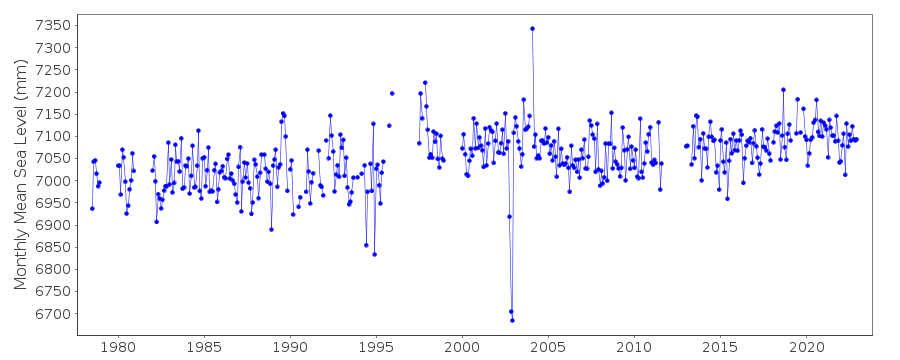
| Time span of RLR data: | 1978 – 2022 |
| RLR completeness (%): | 80 |
| Time span of metric data: | 1957 – 2022 |
| Metric completeness (%): | 60 |
| Date of last update: | 02 Nov 2023 |
| Green Arrow: | Current Station |
| Yellow Marker: | Neighbouring RLR Station |
| Red Marker: | Neighbouring Metric Station |
Please note: In many cases, the station position in our database is accurate to only one minute. Thus, the tide gauge may not appear to be on the coast.
Tide Gauge Data

Additional Data Sources (guide to additional data sources)
Nearby GNSS Stations from SONEL: PELB, PLBB, PLBAFast Delivery Data from UHSLC station 184: hourly and daily
Research Quality Data from UHSLC station 184: hourly and daily
Station Documentation
Link to RLR information.Documentation added 1991-06-11
Port Elizabeth 430/088 RLR(1985) is 9.4m below BMDocumentation added 1996-08-28
For discussions of MSL changes and extreme sea levels around Namibia and South Africa, see: G.B.Brundrit, S.Afr.J.Mar.Sci.,16,9-17,1995 and S.Searson and G.B.Brundrit, S.Afr.J.of Science, 91,579-588,1995. 1957 1960 values based on 8 readings a dayDocumentation added 2006-07-24
Data for 2000 were supplied by BODC. The values were supplied to BODC via the University of Cape Town and so are not being classed as official.Documentation added 2006-08-07
Following the recent supply of data from the South African Hydrographic Office the data values for the year 2000 have now been revised with the official values.Documentation added 2009-09-24
Heights of chart datum relative to land levellingdatum LLD(MSL)in South Africa and Namibia: Port Elizabeth
Datum: up to 31st Dec 1978 = -0.838
Datum: 1st Jan 1979 - 31st Dec 1997 = -0.900
Datum: 1st Jan 1998 - 31st Dec 2002 = -1.026
Datum: 1st Jan 2003 onwards = -0.836
Datum is now LAT so unlikely to change. Benchmark PE 1 has been added to the RLR diagram as this is the benchmark referred to in the GLOSS Handbook.
Documentation added 2010-05-11
There appears to be a spike in Nov/Dec 2002. This is possbly real as it appears in several of the S. African stations.Documentation added 2019-10-23
The South African Navy Hydrographic Office (SANHO) are the copyright owners of the Port Elizabeth sea level data and must be contacted to request permission to use the data.Data Authority
Hydrographic OfficeMaritime Headquarters
Private Bag X1
Tokai 7966

![]()
![]()
![]()