Data
- Obtaining
- Supplying
- High-Frequency
- Bottom Pressure Records
- Other Long Records
- GLOSS/ODINAFRICA Calibration Data
Donate
Donate to PSMSL
Data Notes
- Individual Station Data and Plot Notes
- Referencing the Data Set
- PSMSL Help File
- 2010 Changes to the PSMSL Data Files
Extracted from Database
08 Dec 2025
Station Information
| Station ID: | 313 |
| Latitude: | 63.425224 |
| Longitude: | 9.101504 |
| Coastline code: | 40 |
| Station code: | 151 |
| Country: | NORWAY |
| Time span of data: | 1928 – 2024 |
| Completeness (%): | 97 |
| Date of last update: | 09 Jan 2025 |
| Green Arrow: | Current Station |
| Yellow Marker: | Neighbouring RLR Station |
| Red Marker: | Neighbouring Metric Station |
Please note: In many cases, the station position in our database is accurate to only one minute. Thus, the tide gauge may not appear to be on the coast.
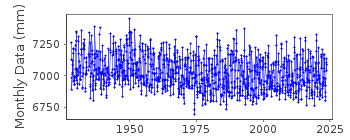
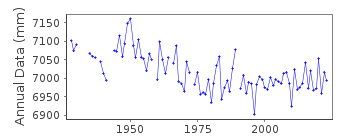
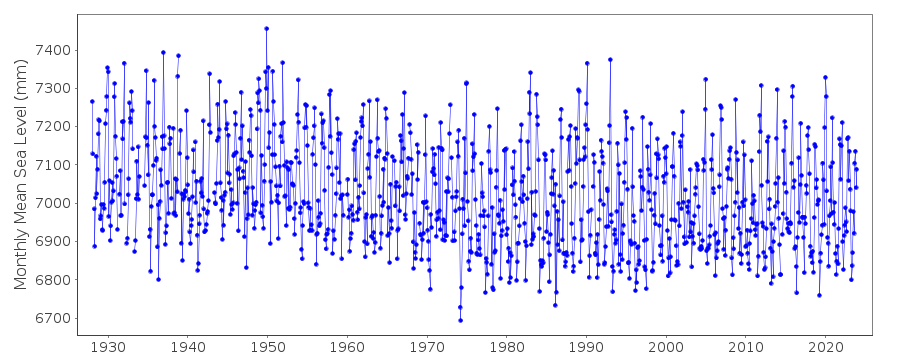
Tide Gauge Data
Additional Data Sources (guide to additional data sources)
Nearby Real Time Stations from VLIZ: heimStation Documentation
Link to RLR information.Documentation added 1991-06-11
Heimsjo 040/151 RLR(1967) is 9.9m below BM E24N1Documentation added 1993-07-29
Anomalously low value for June 1958 - checked correct as received from authority.Documentation added 1995-03-30
Tide gauge network modernised, new equipment installed in 1990Documentation added 2009-01-28
Following the input of revised data values station made Metric awaiting datum information.Documentation added 2009-04-06
2007/8 mean sea level values entered as METRIC onlyDocumentation added 2009-04-06
The Norwegian Mapping Authority have revised their datasets TGBM for Heimsjo is now E24 N1 throughout the dataset this is 4.934m above TGZ. Because of this and the advent of the newdatabase it was decided to re-calculate RLR. RLR year is now 2008 the recalculated to RLR factor is 5.066m. RLR (2008) is 10.0m below TGBM E24 N1
Documentation added 2012-09-05
For information on sea level change along the Norwegian coast see paper"Contributions to sea level variability along the Norwegian coast for 1960-2010"
by K Richter J.E.O. Nilsen and H. Drange.
Documentation added 2013-07-16
Previously data for 1958 was flagged 'suspect' see comment above. However, with an extended dataset the data would appear correct. The flags have been removed.Documentation added 2018-01-25
Monthly mean data values for November 1932 has been revised, August 1934 and October 1944 have been removed and November 1990 has been revised using data supplied by the Norwegian Mapping Authority.Documentation added 2018-08-15
Monthly mean values for November and December 2017 have been replaced due to technical problems at the tide gauge. Revised data was obtained from the Norwegian Mapping Authority website.Data Authority
Norwegian Mapping AuthorityHydrographic Service
Po. Box 60
4001 Stavanger

![]()
![]()
![]()