Western Indian Ocean Sea Level Project
![]()
South African National Report
Intergovernmental Oceanographic Commission
UNESCO
The Western Indian Ocean Sea Level Project is undertaken within the framework of the IOC-Sida-Flanders Marine Science Programme in the region and in response to the recommendation of the IOCINCWIO - IV. The project will produce a comprehensive report on sea level data and analysis in the region.
 ______________________________
This National Report relates to South Africa and has been prepared by
Dr Howard Waldron , Department of Oceanography, University of Cape Town, South Africa with information supplied by Capt. M. Thomson of the Hydrographic Office of the South African Navy. Please note that the site map for Saldanha Bay is a draft copy only and no site map is available for Port Nolloth.Other project participants:
Charles Magori , Kenya
Razafionaina Noasy Tovo , Madagascar
Sachooda Ragoonaden , Mauritius
Antonio Hoguane Mubango , Mozambique
Luc Chang-Ko , Seychelles
Shigalla Mahongo , Tanzania
This collaborative project is being coordinated by Dr Julius Francis , Institute of Marine Sciences, Zanzibar, Tanzania and Mr Mike Odido , Kenya Marine and Fisheries Research Institute, Mombasa, Kenya.
GENERAL OVERVIEW
The National Report for South Africa is in two parts:
(I) Status of sea level observation and related activities.
(II) Compilation of meteorological and oceanographic data during periods when stations have been, and are, operational.
(I)
STATUS OF SEA LEVEL OBSERVATION AND RELATED ACTIVITIES
1. Introduction
South Africa occupies 1 219 080 square kilometres at the southernmost tip of the African continent, stretching from the Limpopo River in the North to Cape Agulhas in the South. On the west coast border is the South Atlantic Ocean, while the eastern coastline runs along the Indian Ocean. In the north, South Africa borders Namibia, Botswana and Zimbabwe, while Mozambique and Swaziland border on the North-East.
South Africa has a total population (as at 27 April 1994, according to the Central Statistical Service (CSS)) of approximately 40 284 640. (Regional population figures quoted in this document are also based on CSS figures).
South Africa is divided into 9 regions or provinces:
Western Cape, Eastern Cape, Northern Cape, Orange Free State, KwaZulu/Natal, North-West, Gauteng (formerly PWV), Eastern Transvaal, Northern Transvaal.
The South African coastline is approximately 3000 km in length and for aesthetic, recreational and economic reasons, it is an enormous national asset. In his PhD thesis (Dept of Oceanography, University of Cape Town, 1992, 215pp.), Peter Hughes divided the coastline into four geomorphological regions:
The West Coast: Namibia to St Helena Bay (120 km north of Cape Town). This is a dry semi-desert coastline with a low, wide and flat coastal plain cut by ephemeral rivers and salt pans. The shoreline is a combination of long sandy beaches interrupted by short sections of mixed rocky and sandy bays and promontories. The long axes of small log-spiral bays point in a north-westerly direction. Conditions are harsh and population densities are very low. The coast faces west-south-west to westerly.
The South-West Coast: St Helena Bay to Cape Agulhas (southernmost tip of Africa). Warm temperate climate with winter rainfall confined to orographic highs. The coastal plain is generally wide and bounded by a combination of long open sandy beaches and rocky headlands and cliffs which often hold small pocket beaches. The coastal plain tends to narrow towards the centre of the region where cliffed sections begin to predominate. The shoreline becomes rockier southwards and rivers are usually open for at least several months of the year. Population densities range from low in the north to high, centred around the Greater Cape Town area.
The South Coast: Cape Agulhas to Cape Padrone (50 km East of Port Elizabeth). Mixed rocky coastline with pocket beaches becoming sandier towards the east where large log-spiral bays become characteristic, pointing towards the north-east. The wide, flat and low coastal plain narrows towards the east and is cut by tidal inlets and estuaries with tidal reaches extending several tens of kilometres inland. Warm temperate climate, generally with all seasons rainfall and medium to to high population densities in coastal towns, cities and resorts.
The East Coast: Cape Padrone to Mozambique. Linear trending monoclinal coastline with irregular, indented rocky section separated by linear or arcuate beaches, often coarse grained. The coastal plain is very narrow towards the south and rivers are deeply incised forming drowned river mouths rather than estuaries. North of Durban the coastal plain starts to widen again and the rivers become less deeply incised with wider floodplains. Barrier dunes are formed towards the north. The climate is subtropical with mostly unimodal summer rains. Population densities along the coast are medium, but high within 150 km north and south of Durban, decreasing northwards to low and very low near the Mozambique border.
The SA Naval Hydrographic Office was formed in 1954. Installation of the first of its own KENT float-type gauges followed in 1957 and the operation of certain SA Railways and Harbours gauges seems to have been taken over at about the same time. Occasional additions were made to the original network of KENT gauges using LEA, OTT and SIAP float-type gauges. Twelve tidal stations were in operation by 1989 but it was considered that most of the gauges were getting too old (Note that two of the original mechanical gauges continue in service in tandem with their modern replacements).
At this stage, the EMATEK Division of the CSIR was commissioned to design and construct acoustic Automatic Water Level recorders (AWLRs) incorporating barometers and temperature sensors. A total of eight were acquired but they never proved to be a success and after several years of perserverance, they were abandoned in 1996/97. The exception is the AWLR at Walvis Bay which operates successfully and has produced good, accurate datasets for the last two years.
The AWLRs were replaced with ten SRD acoustic gauges which were installed in 1996/97. These have produced continuous datasets but their accuracy is, in many cases, unacceptably variable. To date, this difficulty remains to be resolved and plans are well advanced for the acquisition of a new generation of float-actuated gauges to supplement the existing network.
The Bidston Observatory provided tidal predictions until 1964, at which stage the first South African Tide Tables (for 1965) were issued. These have been issued annually ever since.
2. Status of Sea Level Network
2.1 Installed and operational stations
This section gives details of the tide gauges at Port Nolloth, Saldanha Bay, Cape Town, Simon's Town, Mossel Bay, Knysna, Port Elizabeth, East London, Durban and Richards Bay. For the sake of completeness, a supplementary section has been completed giving details of tide gauges at Walvis Bay and Lüderitz. These are under the jurisdiction of Namibia but form part of the sea level network in a southern African context.
PORT NOLLOTH
Location:
Photograph and Site Map:
Latitude and Longitude:
Gauges previously installed (type, model, duration of operation):
Gauge currently installed (type, model and serial number, year of installation):
Organisation responsible for tide gauge station (name and address):
Organisation performing maintenance (name and address):
List and description of tide benchmarks (when installed and by whom):
All are bronze pegs, the former two installed by the Hydrographer in conjunction with the Director-General of Surveys and the latter by the University of Cape Town on 4 November 1997.
Benchmark levelling information (dates and details of levelling data):
Tide gauge transducer face was 4.461 m above MSL (5.385 m above Chart Datum).
Tide predictions for station performed by where and by whom:
Which projects the station is dedicated to (GLOSS, WOCE, PSMSL):
Data centres to which data is sent:
Data format (analogue charts, diskettes):
Data communication at station (satellite, email, fax, airmail):
Nearest meteorological station:
Other data available (precipitation, winds, sst, river runoff):
SALDANHA BAY
Location:
Photograph and Site Map:
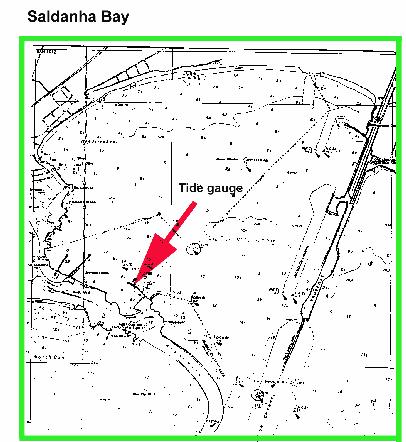
Latitude and Longitude:
Gauges previously installed (type, model, duration of operation):
Gauge currently installed (type, model and serial number, year of installation):
Organisation responsible for tide gauge station (name and address):
Organisation performing maintenance (name and address):
List and description of tide benchmarks (when installed and by whom):
Both are bronze pegs.
Benchmark levelling information (dates and details of levelling data):
Transducer face was 3.817 m above MSL (4.792 m above Chart Datum).
Tide predictions for station performed by where and by whom:
Which projects the station is dedicated to (GLOSS, WOCE, PSMSL):
Data centres to which data is sent:
Data format (analogue charts, diskettes):
Data communication at station (satellite, email, fax, airmail):
Nearest meteorological station:
Other data available (precipitation, winds, sst, river runoff):
CAPE TOWN
Location:
Photograph and Site Map:
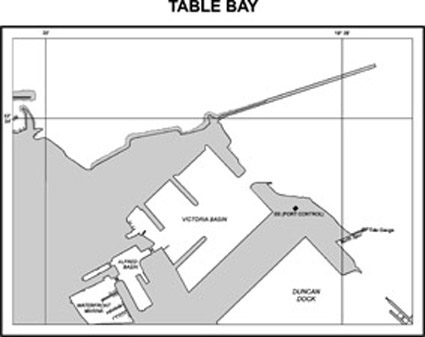
Latitude and Longitude:
Gauges previously installed (type, model, duration of operation):
Gauge currently installed (type, model and serial number, year of installation):
Organisation responsible for tide gauge station (name and address):
Organisation performing maintenance (name and address):
List and description of tide benchmarks (when installed and by whom):
Installed by Chief Director, Surveys and Land Information prior to December 1996.
All are bronze pegs.
Benchmark levelling information (dates and details of levelling data):
Transducer face was 3.855 m above MSL (4.830 m above Chart datum).
Tide predictions for station performed by where and by whom:
Which projects the station is dedicated to (GLOSS, WOCE, PSMSL):
Data centres to which data is sent:
Data format (analogue charts, diskettes):
Data communication at station (satellite, email, fax, airmail):
Nearest meteorological station:
Other data available (precipitation, winds, sst, river runoff):
SIMON'S TOWN
Location:
Photograph and Site Map:
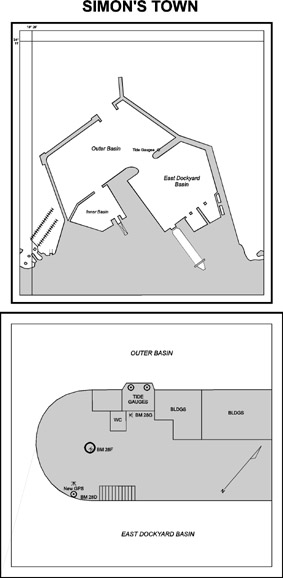
Latitude and Longitude:
Gauges previously installed (type, model, duration of operation):
Gauge currently installed (type, model and serial number, year of installation):
Organisation responsible for tide gauge station (name and address):
Organisation performing maintenance (name and address):
List and description of tide benchmarks (when installed and by whom):
Installed by the Chief Director, Surveys and Mapping.
Heights confirmed March 1998.
Installed by the University of Cape Town
Benchmark levelling information (dates and details of levelling data):
Transducer face was 3.989 above MSL (4.992 m above Chart Datum.
Tide gauge stilling well cover (TGZ) was 3.952 m above MSL (4.955 m above Chart datum).
Tide predictions for station performed by where and by whom:
Which projects the station is dedicated to (GLOSS, WOCE, PSMSL):
Data centres to which data is sent:
Data format (analogue charts, diskettes):
Data communication at station (satellite, email, fax, airmail):
Nearest meteorological station:
Other data available (precipitation, winds, sst, river runoff):
MOSSEL BAY
Location:
Photograph and Site Map:
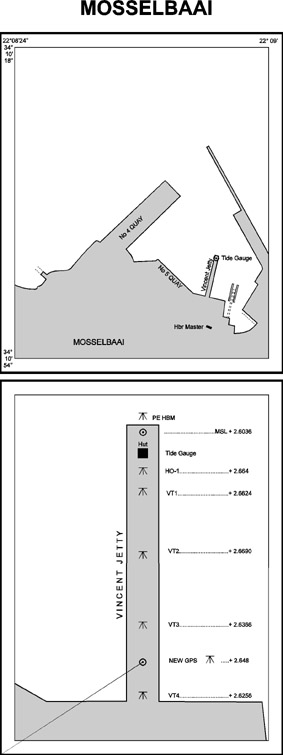
Latitude and Longitude:
Gauges previously installed (type, model, duration of operation):
Gauge currently installed (type, model and serial number, year of installation):
Organisation responsible for tide gauge station (name and address):
Organisation performing maintenance (name and address):
List and description of tide benchmarks (when installed and by whom):
Installed by SA Railways and Harbours, date not known.
Levelled by the Director of Surveys and Mapping.
Installed by Hydrographic Office, October 1993.
Installed November 1997 by the University of Cape Town.
Benchmark levelling information (dates and details of levelling data):
Transducer face was 3.581 m above MSL (4.744 m above Chart Datum).
Tide predictions for station performed by where and by whom:
Which projects the station is dedicated to (GLOSS, WOCE, PSMSL):
Data centres to which data is sent:
Data format (analogue charts, diskettes):
Data communication at station (satellite, email, fax, airmail):
Nearest meteorological station:
Other data available (precipitation, winds, sst, river runoff):
KNYSNA
Location:
Photograph and Site Map:
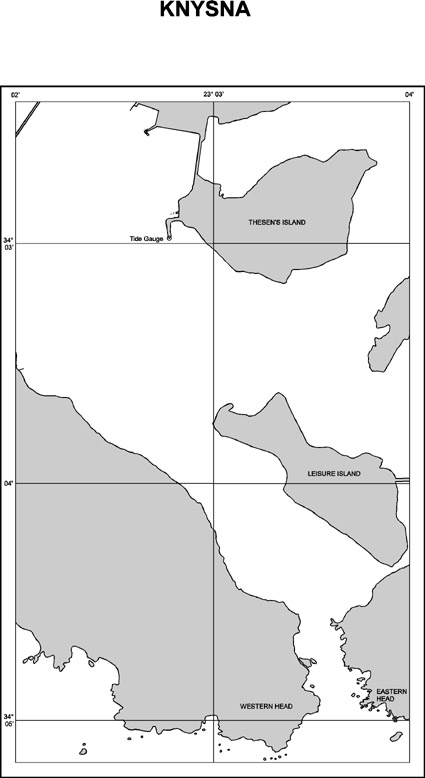
Latitude and Longitude:
Gauges previously installed (type, model, duration of operation):
Gauge currently installed (type, model and serial number, year of installation):
Organisation responsible for tide gauge station (name and address):
Organisation performing maintenance (name and address):
List and description of tide benchmarks (when installed and by whom):
All are bronze pegs.
All were last levelled by the Chief Director, Surveys and Land Information in April 1997.
Benchmark levelling information (dates and details of levelling data):
Transducer face was 3.557 m above MSL (4.605 m above Chart Datum).
Tide predictions for station performed by where and by whom:
Which projects the station is dedicated to (GLOSS, WOCE, PSMSL):
Data centres to which data is sent:
Data format (analogue charts, diskettes):
Data communication at station (satellite, email, fax, airmail):
Nearest meteorological station:
Other data available (precipitation, winds, sst, river runoff):
PORT ELIZABETH
Location:
Photograph and Site Map:
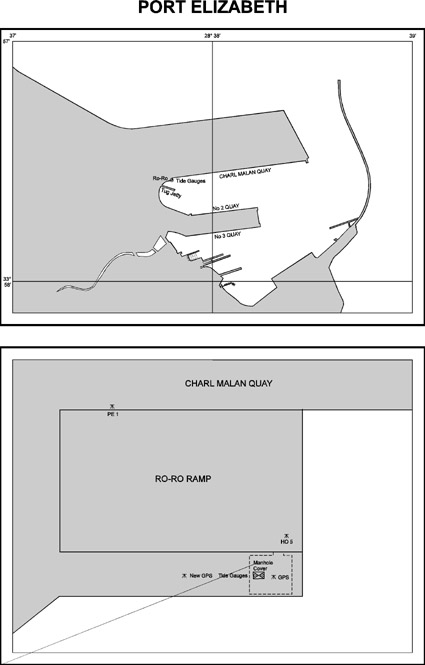
Latitude and Longitude:
Gauges previously installed (type, model, duration of operation):
Gauge currently installed (type, model and serial number, year of installation):
Organisation responsible for tide gauge station (name and address):
Organisation performing maintenance (name and address):
List and description of tide benchmarks (when installed and by whom):
Installed by Chief Director, Surveys and Mapping 1989.
Installed by the Hydrographic Office 3 March 1998.
Benchmark levelling information (dates and details of levelling data):
Transducer face was 3.598 m above MSL (4.624 m above Chart Datum).
Tide predictions for station performed by where and by whom:
Which projects the station is dedicated to (GLOSS, WOCE, PSMSL):
Data centres to which data is sent:
Data format (analogue charts, diskettes):
Data communication at station (satellite, email, fax, airmail):
Nearest meteorological station:
Other data available (precipitation, winds, sst, river runoff):
EAST LONDON
Location:
Photograph and Site Map:
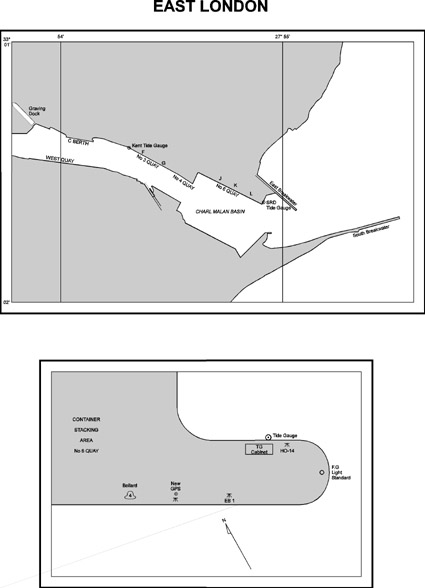
Latitude and Longitude:
Gauges previously installed (type, model, duration of operation):
Gauge currently installed (type, model and serial number, year of installation):
Organisation responsible for tide gauge station (name and address):
Organisation performing maintenance (name and address):
List and description of tide benchmarks (when installed and by whom):
a. Adjacent to KENT tide gauge
Installed by the Hydrographic Office in October 1993.
Installation date unknown.
b. Adjacent SRD tide gauge.
Installed and levelled by the Chief Surveyor General in December 1996.
Installed by Hydrographic Office 4 March 1998.
Benchmark levelling information (dates and details of levelling data):
Tide predictions for station performed by where and by whom:
Which projects the station is dedicated to (GLOSS, WOCE, PSMSL):
Data centres to which data is sent:
Data format (analogue charts, diskettes):
Data communication at station (satellite, email, fax, airmail):
Nearest meteorological station:
Other data available (precipitation, winds, sst, river runoff):
DURBAN
Location:
Photograph and Site Map:
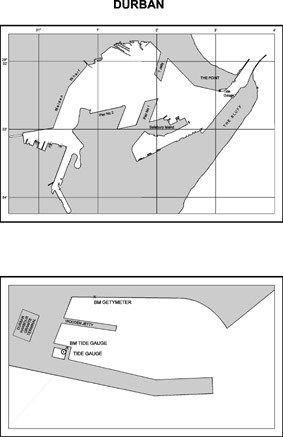
Latitude and Longitude:
Gauges previously installed (type, model, duration of operation):
Gauge currently installed (type, model and serial number, year of installation):
Organisation responsible for tide gauge station (name and address):
Organisation performing maintenance (name and address):
List and description of tide benchmarks (when installed and by whom):
All were re-levelled in August 1995 by Surveys and Land Information.
Installed by the Hydrographic Office 5 March 1998.
All are brass pegs.
Benchmark levelling information (dates and details of levelling data):
Tide predictions for station performed by where and by whom:
Which projects the station is dedicated to (GLOSS, WOCE, PSMSL):
Data centres to which data is sent:
Data format (analogue charts, diskettes):
Data communication at station (satellite, email, fax, airmail):
Nearest meteorological station:
Other data available (precipitation, winds, sst, river runoff):
RICHARDS BAY
Location:
Photograph and Site Map:
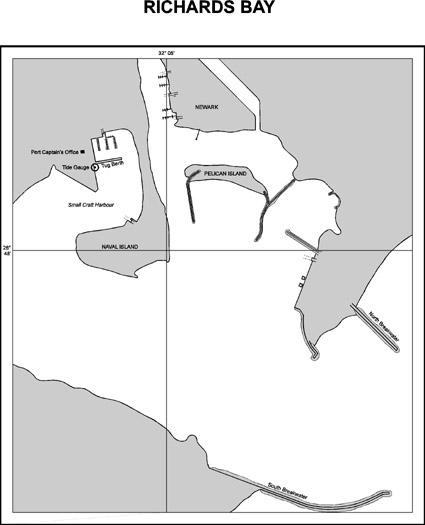
Latitude and Longitude:
Gauges previously installed (type, model, duration of operation):
Gauge currently installed (type, model and serial number, year of installation):
Organisation responsible for tide gauge station (name and address):
Organisation performing maintenance (name and address):
List and description of tide benchmarks (when installed and by whom):
Installed by SA Railways and Harbours.
Installed by the Hydrographic Office.
All are bronze pegs.
Benchmark levelling information (dates and details of levelling data):
Tide predictions for station performed by where and by whom:
Which projects the station is dedicated to (GLOSS, WOCE, PSMSL):
Data centres to which data is sent:
Data format (analogue charts, diskettes):
Data communication at station (satellite, email, fax, airmail):
Nearest meteorological station:
Other data available (precipitation, winds, sst, river runoff):
WALVIS BAY
Location:
Photograph and Site Map:
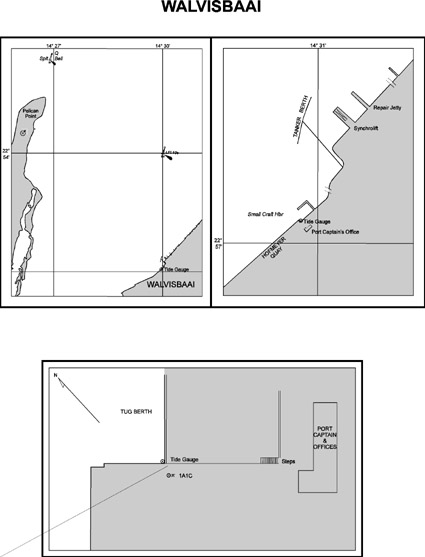
Latitude and Longitude:
Gauges previously installed (type, model, duration of operation):
Gauge currently installed (type, model and serial number, year of installation):
Organisation responsible for tide gauge station (name and address):
Organisation performing maintenance (name and address):
List and description of tide benchmarks (when installed and by whom):
Benchmark levelling information (dates and details of levelling data):
Tide predictions for station performed by where and by whom:
Which projects the station is dedicated to (GLOSS, WOCE, PSMSL):
Data centres to which data is sent:
Data format (analogue charts, diskettes):
Data communication at station (satellite, email, fax, airmail):
Nearest meteorological station:
Other data available (precipitation, winds, sst, river runoff):
Nil.
LÜDERITZ
Location:
Photograph and Site Map:
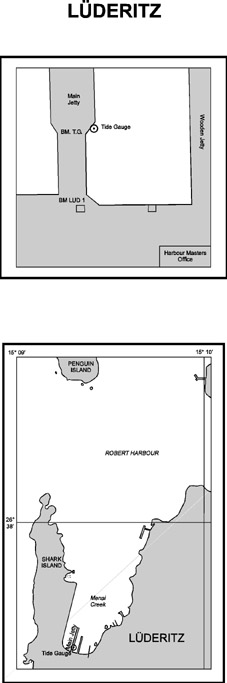
Latitude and Longitude:
Gauges previously installed (type, model, duration of operation):
Gauge currently installed (type, model and serial number, year of installation):
Organisation responsible for tide gauge station (name and address):
Organisation performing maintenance (name and address):
List and description of tide benchmarks (when installed and by whom):
Installed by the Hydrographer 1968.
Installed by the Namibian Surveyor General in April 1998.
Benchmark levelling information (dates and details of levelling data):
Tide predictions for station performed by where and by whom:
Which projects the station is dedicated to (GLOSS, WOCE, PSMSL):
Data centres to which data is sent:
Data format (analogue charts, diskettes):
Data communication at station (satellite, email, fax, airmail):
Nearest meteorological station:
Other data available (precipitation, winds, sst, river runoff):
Nil.
2.2 Installed but not operational
2.3 Planned station(s)
3. Availability of data from the tide gauge stations
Observed, edited and calibrated hourly heights available in digital form.
4. Capacity available
4.1 Installation and maintenance of gauges
4.2 Analysis and interpretation of data
5. Sea level products
6. Bibliography of sea level literature
7. Recommendations
(II)
COMPILATION OF OCEANOGRAPHIC AND METEOROLOGICAL DATA
Dr Marten Gründlingh
Manager, SADCO, PO Box 320, 7599 Stellenbosch, South Africa
Tel (+27) (21) 887 5101 Fax (+27) (21) 887 5142
email mgrundli@csir.co.zainternet http://fred.csir.co.za/ematek/sadco.html
South African Weather Bureau (SAWB)
Information Section, Private Bag X097, Pretoria, Gauteng, RSA.
Tel (+27) (12) 309 3104 Fax (+27) (12) 309 3990
email climenq@cirrus.sawb.gov.za
Monthly means of Air Temperature (degrees C), Precipitation (mm), Air Pressure (at 0800 hrs [hPa]) and Wind (speed [m/s] and Direction [direction frequency per thousand for each of the eight main directions])
Saldanha Bay (Cape Columbine)
|
Air Temperature (Deg C) |
Precipitation (mm) |
Air Pressure (hPa) |
|
|
January |
17.5 |
6 |
1007.2 |
|
February |
17.5 |
4 |
1006.8 |
|
March |
17.0 |
10 |
1008.0 |
|
April |
16.3 |
20 |
1009.4 |
|
May |
15.0 |
33 |
1011.1 |
|
June |
13.6 |
47 |
1013.5 |
|
July |
13.0 |
36 |
1014.8 |
|
August |
13.2 |
38 |
1013.8 |
|
September |
13.9 |
19 |
1012.1 |
|
October |
15.0 |
12 |
1010.9 |
|
November |
16.0 |
9 |
961.5 |
|
December |
17.0 |
6 |
967.7 |
|
Annual |
18.9 (mean) |
240 (total) |
1003.1 (mean) |
Wind data: Average direction frequency per thousand (N) and the average speed (V = m/s) for each of the eight main directions.
|
N |
NE |
E |
SE |
S |
SW |
W |
NW |
|||||||||
|
N |
V |
N |
V |
N |
V |
N |
V |
N |
V |
N |
V |
N |
V |
N |
V |
|
|
January |
37 |
5.0 |
32 |
5.0 |
4 |
4.1 |
94 |
8.1 |
568 |
8.9 |
135 |
6.1 |
25 |
4.0 |
59 |
4.6 |
|
February |
35 |
5.1 |
41 |
4.4 |
7 |
4.7 |
98 |
8.3 |
578 |
8.4 |
96 |
5.7 |
29 |
4.3 |
57 |
4.7 |
|
March |
46 |
4.8 |
41 |
3.9 |
16 |
4.6 |
115 |
7.2 |
537 |
8.1 |
98 |
5.3 |
26 |
3.6 |
56 |
4.6 |
|
April |
61 |
5.5 |
72 |
4.1 |
21 |
4.0 |
139 |
6.9 |
417 |
7.1 |
82 |
5.1 |
29 |
3.8 |
84 |
4.6 |
|
May |
112 |
6.5 |
113 |
5.0 |
32 |
4.7 |
141 |
5.9 |
280 |
6.5 |
71 |
4.8 |
33 |
5.3 |
125 |
5.7 |
|
June |
143 |
7.4 |
153 |
5.8 |
47 |
4.3 |
135 |
5.6 |
210 |
6.0 |
50 |
5.6 |
36 |
7.1 |
127 |
6.5 |
|
July |
111 |
6.7 |
122 |
5.5 |
46 |
4.0 |
152 |
6.0 |
235 |
6.2 |
61 |
5.6 |
41 |
6.8 |
133 |
6.6 |
|
August |
93 |
7.2 |
65 |
5.3 |
33 |
5.0 |
150 |
6.4 |
286 |
7.2 |
95 |
5.9 |
44 |
7.0 |
145 |
7.2 |
|
September |
67 |
6.8 |
33 |
4.8 |
17 |
4.3 |
138 |
6.5 |
382 |
8.0 |
106 |
5.6 |
48 |
4.8 |
143 |
6.1 |
|
October |
56 |
5.6 |
31 |
4.4 |
11 |
6.8 |
117 |
7.4 |
449 |
8.5 |
136 |
5.9 |
46 |
5.2 |
86 |
5.7 |
|
November |
41 |
5.2 |
33 |
4.8 |
3 |
5.6 |
100 |
8.2 |
556 |
9.1 |
119 |
6.2 |
30 |
4.5 |
74 |
5.2 |
|
December |
37 |
5.5 |
22 |
4.6 |
5 |
5.5 |
78 |
8.4 |
559 |
9.2 |
150 |
6.2 |
36 |
4.7 |
71 |
5.5 |
|
Annual (mean) |
70 |
6.3 |
63 |
5.0 |
20 |
4.5 |
121 |
6.9 |
421 |
8.1 |
100 |
5.7 |
35 |
5.3 |
97 |
5.8 |
Cape Town and Simon's Town (Cape Town International Airport)
|
Air Temperature (Deg C) |
Precipitation (mm) |
Air Pressure (hPa) |
|
|
January |
20.9 |
15 |
1009.4 |
|
February |
21.0 |
17 |
1008.8 |
|
March |
19.8 |
20 |
1010.0 |
|
April |
17.5 |
41 |
1011.5 |
|
May |
14.8 |
69 |
1012.9 |
|
June |
13.0 |
93 |
1015.8 |
|
July |
12.2 |
82 |
1016.7 |
|
August |
12.7 |
77 |
1016.3 |
|
September |
14.0 |
40 |
1014.3 |
|
October |
16.0 |
30 |
1013.4 |
|
November |
18.4 |
14 |
1011.9 |
|
December |
19.9 |
17 |
1009.8 |
|
Annual |
16.7 (mean) |
515 (total) |
1012.6 (mean) |
Wind data: Average direction frequency per thousand (N) and the average speed (V = m/s) for each of the eight main directions.
|
N |
NE |
E |
SE |
S |
SW |
W |
NW |
|||||||||
|
N |
V |
N |
V |
N |
V |
N |
V |
N |
V |
N |
V |
N |
V |
N |
V |
|
|
January |
32 |
4.8 |
5 |
3.4 |
2 |
5.3 |
109 |
7.9 |
471 |
7.8 |
127 |
5.2 |
15 |
5.2 |
124 |
6.1 |
|
February |
23 |
5.2 |
7 |
4.1 |
1 |
6.5 |
115 |
7.6 |
413 |
7.5 |
150 |
5.1 |
19 |
4.6 |
118 |
5.8 |
|
March |
27 |
4.5 |
11 |
3.5 |
4 |
5.5 |
95 |
7.1 |
374 |
6.6 |
145 |
4.6 |
24 |
4.5 |
110 |
5.4 |
|
April |
57 |
5.2 |
23 |
3.9 |
5 |
5.8 |
90 |
6.8 |
233 |
5.5 |
121 |
3.8 |
20 |
3.8 |
154 |
5.2 |
|
May |
103 |
5.9 |
45 |
4.1 |
3 |
2.6 |
59 |
5.3 |
137 |
5.1 |
60 |
3.4 |
26 |
4.1 |
218 |
5.9 |
|
June |
151 |
6.5 |
77 |
4.3 |
6 |
3.1 |
41 |
5.9 |
88 |
4.7 |
40 |
3.2 |
28 |
4.3 |
204 |
6.1 |
|
July |
126 |
6.1 |
76 |
4.1 |
3 |
4.3 |
59 |
5.7 |
107 |
4.9 |
57 |
3.4 |
24 |
4.8 |
209 |
6.3 |
|
August |
106 |
6.3 |
47 |
3.9 |
5 |
6.0 |
86 |
6.7 |
157 |
5.3 |
51 |
3.7 |
30 |
5.0 |
211 |
6.5 |
|
September |
70 |
5.9 |
34 |
4.1 |
3 |
3.8 |
117 |
6.5 |
218 |
5.9 |
76 |
4.0 |
33 |
4.8 |
190 |
6.7 |
|
October |
62 |
5.7 |
17 |
3.3 |
6 |
6.9 |
124 |
7.5 |
304 |
6.9 |
105 |
4.8 |
34 |
5.5 |
160 |
6.3 |
|
November |
35 |
5.7 |
6 |
4.2 |
5 |
5.0 |
143 |
8.2 |
416 |
7.9 |
120 |
5.0 |
31 |
5.2 |
124 |
6.4 |
|
December |
39 |
6.2 |
4 |
5.3 |
4 |
5.3 |
119 |
8.1 |
422 |
7.9 |
125 |
5.5 |
22 |
5.2 |
158 |
6.4 |
|
Annual (mean) |
69 |
5.9 |
29 |
4.0 |
4 |
5.0 |
96 |
7.2 |
278 |
6.9 |
98 |
4.6 |
26 |
4.8 |
165 |
6.1 |
Mossel Bay (Cape St. Blaize)
|
Air Temperature (Deg C) |
Precipitation (mm) |
Air Pressure (hPa) |
|
|
January |
20.9 |
18 |
1007.6 |
|
February |
20.7 |
23 |
1007.6 |
|
March |
19.8 |
31 |
1009.3 |
|
April |
18.2 |
46 |
1009.8 |
|
May |
16.8 |
37 |
1010.8 |
|
June |
15.7 |
35 |
1012.9 |
|
July |
15.0 |
29 |
1014.4 |
|
August |
14.8 |
44 |
1013.6 |
|
September |
15.3 |
29 |
1012.3 |
|
October |
16.3 |
36 |
1011.6 |
|
November |
17.9 |
32 |
1009.9 |
|
December |
19.7 |
24 |
1008.1 |
|
Annual |
17.7 (mean) |
384 (total) |
1010.7 |
Wind data: Average direction frequency per thousand (N) and the average speed (V = m/s) for each of the eight main directions.
|
N |
NE |
E |
SE |
S |
SW |
W |
NW |
|||||||||
|
N |
V |
N |
V |
N |
V |
N |
V |
N |
V |
N |
V |
N |
V |
N |
V |
|
|
January |
14 |
3.3 |
29 |
6.5 |
108 |
10.0 |
213 |
7.6 |
130 |
6.2 |
346 |
6.8 |
49 |
5.0 |
49 |
3.5 |
|
February |
15 |
3.5 |
39 |
5.1 |
115 |
9.5 |
203 |
7.5 |
120 |
5.8 |
306 |
6.3 |
55 |
5.4 |
64 |
3.8 |
|
March |
22 |
3.8 |
46 |
5.1 |
120 |
8.8 |
152 |
6.7 |
120 |
5.5 |
273 |
5.9 |
62 |
4.9 |
91 |
3.8 |
|
April |
36 |
3.6 |
53 |
4.2 |
102 |
8.2 |
86 |
5.4 |
75 |
4.6 |
269 |
5.5 |
108 |
5.3 |
159 |
4.3 |
|
May |
42 |
4.2 |
57 |
4.3 |
62 |
6.3 |
49 |
5.5 |
43 |
4.4 |
249 |
5.1 |
156 |
5.5 |
273 |
4.6 |
|
June |
54 |
4.3 |
57 |
4.2 |
37 |
6.1 |
20 |
3.9 |
29 |
4.2 |
212 |
5.2 |
185 |
5.5 |
334 |
5.3 |
|
July |
41 |
4.5 |
48 |
4.9 |
52 |
7.4 |
39 |
5.1 |
30 |
4.1 |
252 |
5.1 |
156 |
5.6 |
298 |
5.0 |
|
August |
34 |
4.2 |
49 |
4.9 |
74 |
7.2 |
65 |
6.5 |
47 |
6.3 |
287 |
6.0 |
148 |
5.8 |
230 |
4.9 |
|
September |
27 |
3.8 |
47 |
5.2 |
91 |
8.9 |
89 |
6.4 |
74 |
5.7 |
310 |
6.3 |
121 |
5.4 |
157 |
4.4 |
|
October |
21 |
4.0 |
37 |
5.8 |
127 |
9.9 |
123 |
7.4 |
91 |
6.1 |
350 |
6.6 |
89 |
5.6 |
94 |
4.2 |
|
November |
15 |
3.4 |
32 |
5.6 |
118 |
9.3 |
194 |
7.6 |
111 |
5.9 |
336 |
6.5 |
64 |
5.6 |
57 |
3.9 |
|
December |
16 |
3.1 |
34 |
5.3 |
101 |
9.6 |
201 |
7.4 |
119 |
5.9 |
361 |
6.8 |
55 |
5.7 |
46 |
3.9 |
|
Annual (mean) |
28 |
4.0 |
44 |
5.0 |
92 |
8.8 |
120 |
7.0 |
82 |
5.6 |
296 |
6.1 |
104 |
5.5 |
154 |
4.6 |
Knysna (George Airport)
|
Air Temperature (Deg C) |
Precipitation (mm) |
Air Pressure (hPa) |
|
|
January |
24.4 |
134 |
991.7 |
|
February |
24.6 |
113 |
991.5 |
|
March |
23.9 |
120 |
992.8 |
|
April |
21.7 |
73 |
993.5 |
|
May |
19.1 |
59 |
994.7 |
|
June |
16.8 |
28 |
997.3 |
|
July |
16.6 |
39 |
997.9 |
|
August |
17.7 |
62 |
997.8 |
|
September |
19.3 |
73 |
996.1 |
|
October |
20.4 |
98 |
995.7 |
|
November |
21.8 |
108 |
994.0 |
|
December |
23.4 |
102 |
991.9 |
|
Annual |
20.8 (mean) |
1009 (total) |
994.6 (mean) |
Wind data: Average direction frequency per thousand (N) and the average speed (V = m/s) for each of the eight main directions.
|
N |
NE |
E |
SE |
S |
SW |
W |
NW |
|||||||||
|
N |
V |
N |
V |
N |
V |
N |
V |
N |
V |
N |
V |
N |
V |
N |
V |
|
|
January |
2 |
1.8 |
5 |
3.9 |
153 |
5.1 |
152 |
4.6 |
122 |
4.1 |
113 |
4.7 |
80 |
4.1 |
24 |
3.1 |
|
February |
0 |
0.0 |
8 |
4.2 |
166 |
5.1 |
122 |
4.4 |
125 |
3.9 |
100 |
4.3 |
71 |
4.3 |
26 |
4.5 |
|
March |
3 |
2.5 |
5 |
2.1 |
113 |
4.6 |
116 |
4.1 |
102 |
3.5 |
75 |
4.2 |
67 |
4.6 |
33 |
3.0 |
|
April |
7 |
3.4 |
6 |
2.0 |
62 |
4.0 |
87 |
3.4 |
83 |
3.2 |
60 |
4.9 |
86 |
5.4 |
51 |
4.5 |
|
May |
20 |
5.2 |
10 |
1.7 |
41 |
3.7 |
51 |
2.7 |
59 |
2.7 |
63 |
4.6 |
111 |
5.3 |
130 |
4.8 |
|
June |
24 |
5.9 |
7 |
2.3 |
31 |
3.4 |
31 |
2.7 |
43 |
2.7 |
52 |
3.8 |
151 |
5.3 |
172 |
4.7 |
|
July |
24 |
4.8 |
14 |
2.7 |
44 |
3.3 |
41 |
3.5 |
52 |
3.1 |
51 |
4.0 |
142 |
5.3 |
141 |
4.3 |
|
August |
14 |
8.0 |
13 |
2.4 |
67 |
4.2 |
67 |
3.7 |
71 |
3.3 |
66 |
4.4 |
134 |
5.5 |
107 |
4.1 |
|
September |
14 |
5.0 |
15 |
2.1 |
75 |
4.7 |
94 |
4.2 |
84 |
3.3 |
79 |
4.8 |
131 |
5.2 |
66 |
4.2 |
|
October |
7 |
4.3 |
5 |
3.3 |
140 |
4.9 |
100 |
4.7 |
102 |
3.6 |
110 |
5.3 |
111 |
4.8 |
55 |
3.9 |
|
November |
4 |
2.5 |
3 |
2.1 |
163 |
5.3 |
125 |
4.7 |
117 |
4.1 |
106 |
4.7 |
103 |
4.4 |
25 |
4.2 |
|
December |
1 |
3.0 |
5 |
2.7 |
144 |
4.7 |
145 |
4.5 |
123 |
4.0 |
118 |
4.6 |
91 |
4.9 |
20 |
4.0 |
|
Annual (mean) |
10 |
5.2 |
8 |
2.6 |
100 |
4.7 |
94 |
4.2 |
90 |
3.6 |
83 |
4.6 |
107 |
5.0 |
71 |
4.3 |
Port Elizabeth
|
Air Temperature (Deg C) |
Precipitation (mm) |
Air Pressure (hPa) |
|
|
January |
21.7 |
36 |
1007.1 |
|
February |
21.6 |
40 |
1006.9 |
|
March |
20.7 |
54 |
1007.9 |
|
April |
18.7 |
58 |
1009.2 |
|
May |
16.6 |
59 |
1010.5 |
|
June |
14.7 |
62 |
1013.1 |
|
July |
14.3 |
47 |
1013.5 |
|
August |
14.7 |
64 |
1013.5 |
|
September |
15.7 |
62 |
1012.0 |
|
October |
17.0 |
59 |
1011.4 |
|
November |
18.5 |
49 |
1009.6 |
|
December |
20.3 |
34 |
1007.2 |
|
Annual |
17.9 (mean) |
624 (total) |
1010.2 (mean) |
Wind data: Average direction frequency per thousand (N) and the average speed (V = m/s) for each of the eight main directions.
|
N |
NE |
E |
SE |
S |
SW |
W |
NW |
|||||||||
|
N |
V |
N |
V |
N |
V |
N |
V |
N |
V |
N |
V |
N |
V |
N |
V |
|
|
January |
10 |
3.4 |
58 |
5.2 |
219 |
7.1 |
82 |
5.0 |
77 |
5.6 |
295 |
7.2 |
126 |
6.8 |
9 |
3.1 |
|
February |
9 |
3.4 |
58 |
5.6 |
235 |
7.2 |
76 |
4.9 |
55 |
5.1 |
271 |
7.2 |
131 |
6.8 |
8 |
3.4 |
|
March |
12 |
2.8 |
65 |
4.9 |
198 |
6.5 |
63 |
4.7 |
50 |
4.9 |
239 |
6.6 |
153 |
6.6 |
13 |
3.5 |
|
April |
15 |
3.3 |
71 |
4.6 |
147 |
5.7 |
35 |
4.2 |
36 |
4.8 |
210 |
7.0 |
207 |
6.1 |
25 |
3.6 |
|
May |
24 |
3.8 |
62 |
4.4 |
62 |
5.2 |
13 |
3.4 |
27 |
4.3 |
187 |
6.5 |
256 |
6.2 |
61 |
3.7 |
|
June |
40 |
4.1 |
69 |
4.2 |
35 |
4.8 |
8 |
3.7 |
18 |
4.8 |
150 |
6.3 |
276 |
6.0 |
103 |
3.9 |
|
July |
36 |
3.9 |
73 |
4.8 |
44 |
5.5 |
12 |
5.0 |
21 |
5.2 |
171 |
6.7 |
266 |
6.0 |
87 |
4.3 |
|
August |
23 |
4.1 |
67 |
4.9 |
89 |
6.3 |
23 |
5.9 |
34 |
4.6 |
214 |
7.1 |
248 |
6.6 |
55 |
3.7 |
|
September |
17 |
4.0 |
72 |
5.7 |
136 |
6.6 |
36 |
5.5 |
45 |
5.2 |
236 |
7.7 |
231 |
7.0 |
31 |
3.4 |
|
October |
14 |
3.5 |
71 |
6.3 |
196 |
7.5 |
53 |
5.4 |
61 |
5.6 |
251 |
8.2 |
195 |
7.3 |
15 |
3.9 |
|
November |
12 |
2.9 |
70 |
5.5 |
210 |
7.5 |
74 |
5.4 |
62 |
5.7 |
273 |
7.9 |
164 |
7.4 |
8 |
3.1 |
|
December |
8 |
3.5 |
57 |
5.5 |
196 |
7.2 |
72 |
5.4 |
84 |
5.8 |
299 |
7.8 |
144 |
7.3 |
8 |
2.5 |
|
Annual (mean) |
18 |
3.7 |
66 |
5.1 |
147 |
6.8 |
46 |
5.0 |
48 |
5.3 |
233 |
7.3 |
200 |
6.6 |
35 |
3.8 |
East London
|
Air Temperature (Deg C) |
Precipitation (mm) |
Air Pressure (hPa) |
|
|
January |
22.0 |
69 |
999.6 |
|
February |
22.1 |
92 |
999.7 |
|
March |
21.3 |
105 |
1001.0 |
|
April |
19.5 |
83 |
1002.1 |
|
May |
17.7 |
52 |
1003.8 |
|
June |
15.9 |
40 |
1006.4 |
|
July |
15.6 |
47 |
1006.9 |
|
August |
15.9 |
78 |
1006.4 |
|
September |
16.7 |
80 |
1004.7 |
|
October |
17.7 |
102 |
1003.9 |
|
November |
19.1 |
110 |
1002.0 |
|
December |
20.7 |
63 |
999.8 |
|
Annual |
18.7 (mean) |
921 (total) |
1003.0 |
Wind data: Average direction frequency per thousand (N) and the average speed (V = m/s) for each of the eight main directions.
|
N |
NE |
E |
SE |
S |
SW |
W |
NW |
|||||||||
|
N |
V |
N |
V |
N |
V |
N |
V |
N |
V |
N |
V |
N |
V |
N |
V |
|
|
January |
15 |
4.9 |
212 |
7.0 |
161 |
6.4 |
58 |
3.7 |
90 |
4.9 |
222 |
6.1 |
81 |
4.8 |
5 |
3.9 |
|
February |
17 |
4.8 |
237 |
6.8 |
159 |
7.0 |
46 |
3.7 |
78 |
5.2 |
193 |
6.3 |
103 |
5.0 |
6 |
3.3 |
|
March |
30 |
3.9 |
213 |
6.1 |
125 |
6.2 |
35 |
3.3 |
69 |
4.7 |
184 |
6.1 |
136 |
4.6 |
25 |
3.1 |
|
April |
62 |
3.7 |
154 |
5.7 |
78 |
5.5 |
36 |
3.0 |
70 |
4.3 |
152 |
6.4 |
194 |
5.0 |
64 |
3.4 |
|
May |
87 |
3.9 |
80 |
5.3 |
53 |
4.8 |
29 |
2.9 |
58 |
4.1 |
140 |
6.5 |
237 |
5.4 |
150 |
3.8 |
|
June |
100 |
4.2 |
58 |
5.2 |
43 |
4.4 |
29 |
2.4 |
47 |
3.7 |
107 |
6.6 |
258 |
5.9 |
217 |
4.2 |
|
July |
96 |
4.4 |
87 |
5.5 |
48 |
4.9 |
34 |
2.6 |
55 |
3.8 |
126 |
6.7 |
242 |
5.7 |
187 |
4.1 |
|
August |
76 |
4.4 |
121 |
5.8 |
66 |
5.6 |
40 |
3.5 |
71 |
4.5 |
147 |
6.8 |
245 |
5.8 |
115 |
4.1 |
|
September |
45 |
4.3 |
172 |
6.5 |
97 |
6.3 |
39 |
3.8 |
74 |
5.4 |
193 |
7.2 |
204 |
5.6 |
41 |
3.8 |
|
October |
23 |
4.2 |
208 |
7.3 |
143 |
6.7 |
43 |
4.1 |
69 |
5.4 |
230 |
7.3 |
157 |
5.8 |
19 |
3.7 |
|
November |
17 |
4.2 |
200 |
7.3 |
155 |
6.9 |
47 |
3.7 |
89 |
5.0 |
236 |
6.7 |
110 |
5.8 |
11 |
3.6 |
|
December |
11 |
4.8 |
202 |
7.0 |
146 |
6.5 |
54 |
3.7 |
92 |
5.1 |
234 |
6.8 |
91 |
5.4 |
7 |
3.3 |
|
Annual (mean) |
48 |
4.2 |
162 |
6.5 |
106 |
6.3 |
41 |
3.5 |
72 |
4.8 |
180 |
6.6 |
172 |
5.5 |
71 |
4.0 |
Durban (Durban Airport)
|
Air Temperature (Deg C) |
Precipitation (mm) |
Air Pressure (hPa) |
|
|
January |
24.4 |
134 |
1012.0 |
|
February |
24.6 |
113 |
1012.1 |
|
March |
23.9 |
120 |
1013.8 |
|
April |
21.7 |
73 |
1015.3 |
|
May |
19.1 |
59 |
1017.2 |
|
June |
16.8 |
28 |
1020.0 |
|
July |
16.6 |
39 |
1020.7 |
|
August |
17.7 |
62 |
1020.0 |
|
September |
19.3 |
73 |
1017.9 |
|
October |
20.4 |
98 |
1016.8 |
|
November |
21.8 |
108 |
1014.7 |
|
December |
23.4 |
102 |
1012.2 |
|
Annual |
20.8 (mean) |
1009 (total) |
1016.1 |
Wind data: Average direction frequency per thousand (N) and the average speed (V = m/s) for each of the eight main directions.
|
N |
NE |
E |
SE |
S |
SW |
W |
NW |
|||||||||
|
N |
V |
N |
V |
N |
V |
N |
V |
N |
V |
N |
V |
N |
V |
N |
V |
|
|
January |
56 |
4.8 |
242 |
6.4 |
74 |
5.2 |
38 |
3.8 |
158 |
6.0 |
166 |
5.3 |
14 |
2.7 |
13 |
3.7 |
|
February |
75 |
4.6 |
240 |
6.0 |
86 |
5.4 |
35 |
4.0 |
141 |
6.3 |
151 |
5.4 |
12 |
3.1 |
11 |
3.7 |
|
March |
79 |
4.8 |
215 |
6.6 |
67 |
5.0 |
35 |
3.7 |
123 |
6.3 |
154 |
5.1 |
22 |
3.3 |
15 |
3.9 |
|
April |
60 |
4.5 |
153 |
6.2 |
60 |
4.5 |
30 |
4.0 |
112 |
6.7 |
135 |
4.7 |
28 |
3.1 |
20 |
2.9 |
|
May |
43 |
4.2 |
110 |
5.6 |
53 |
4.0 |
20 |
3.6 |
98 |
6.6 |
131 |
5.4 |
35 |
3.1 |
29 |
2.4 |
|
June |
51 |
4.4 |
114 |
5.7 |
51 |
4.0 |
22 |
3.5 |
99 |
6.5 |
112 |
5.2 |
27 |
3.6 |
22 |
3.0 |
|
July |
58 |
4.7 |
116 |
6.2 |
48 |
3.9 |
31 |
4.0 |
108 |
6.6 |
122 |
5.4 |
25 |
4.0 |
23 |
2.9 |
|
August |
74 |
5.4 |
145 |
6.8 |
50 |
4.9 |
29 |
4.0 |
130 |
7.3 |
140 |
5.8 |
25 |
4.0 |
23 |
3.4 |
|
September |
84 |
5.7 |
195 |
7.1 |
49 |
5.5 |
29 |
4.2 |
144 |
6.9 |
183 |
6.0 |
24 |
3.7 |
17 |
3.9 |
|
October |
86 |
5.7 |
233 |
7.2 |
60 |
5.3 |
32 |
5.0 |
164 |
6.8 |
188 |
6.1 |
24 |
3.5 |
17 |
4.6 |
|
November |
71 |
5.8 |
245 |
6.7 |
69 |
5.3 |
37 |
4.1 |
168 |
6.3 |
166 |
6.2 |
17 |
3.3 |
15 |
3.1 |
|
December |
60 |
5.4 |
252 |
6.6 |
71 |
5.2 |
43 |
3.8 |
180 |
6.1 |
151 |
6.1 |
12 |
3.3 |
10 |
3.0 |
|
Annual (mean) |
66 |
5.1 |
188 |
6.5 |
62 |
4.9 |
32 |
4.0 |
135 |
6.5 |
150 |
5.6 |
22 |
3.4 |
18 |
3.3 |
Richards Bay
|
Air Temperature (Deg C) |
Precipitation (mm) |
Air Pressure (hPa) |
|
|
January |
25.2 |
172 |
1008.8 |
|
February |
25.0 |
167 |
1009.1 |
|
March |
24.6 |
107 |
1010.5 |
|
April |
22.5 |
109 |
1011.6 |
|
May |
20.0 |
109 |
1013.5 |
|
June |
17.7 |
57 |
1016.3 |
|
July |
17.6 |
60 |
1017.5 |
|
August |
19.0 |
65 |
1016.3 |
|
September |
20.3 |
77 |
1013.7 |
|
October |
21.3 |
105 |
1014.0 |
|
November |
22.7 |
114 |
1011.7 |
|
December |
24.5 |
86 |
1009.1 |
|
Annual |
21.7 (mean) |
1228 |
1012.7 |
Wind data: Average direction frequency per thousand (N) and the average speed (V = m/s) for each of the eight main directions.
|
N |
NE |
E |
SE |
S |
SW |
W |
NW |
|||||||||
|
N |
V |
N |
V |
N |
V |
N |
V |
N |
V |
N |
V |
N |
V |
N |
V |
|
|
January |
24 |
5.3 |
366 |
7.2 |
99 |
6.5 |
56 |
6.3 |
70 |
7.4 |
210 |
7.9 |
19 |
5.4 |
83 |
5.5 |
|
February |
35 |
5.9 |
316 |
6.4 |
67 |
6.2 |
102 |
7.2 |
129 |
8.2 |
137 |
8.0 |
41 |
4.5 |
94 |
4.7 |
|
March |
34 |
6.6 |
326 |
6.4 |
64 |
5.4 |
68 |
6.4 |
49 |
7.1 |
193 |
7.9 |
49 |
4.0 |
133 |
5.5 |
|
April |
56 |
6.4 |
281 |
6.2 |
44 |
5.3 |
33 |
7.7 |
67 |
8.9 |
130 |
8.1 |
78 |
5.1 |
167 |
5.1 |
|
May |
43 |
5.7 |
197 |
5.9 |
22 |
5.7 |
29 |
7.1 |
100 |
8.0 |
176 |
8.5 |
93 |
5.2 |
197 |
5.0 |
|
June |
67 |
5.5 |
200 |
5.8 |
26 |
4.2 |
15 |
8.0 |
89 |
7.6 |
163 |
8.1 |
107 |
5.6 |
200 |
5.1 |
|
July |
29 |
4.9 |
194 |
5.7 |
50 |
4.1 |
47 |
4.8 |
82 |
8.2 |
190 |
8.9 |
104 |
5.2 |
201 |
5.0 |
|
August |
42 |
5.2 |
239 |
6.6 |
55 |
6.2 |
58 |
5.7 |
103 |
8.5 |
139 |
7.1 |
61 |
5.4 |
203 |
5.5 |
|
September |
60 |
6.4 |
267 |
7.1 |
63 |
7.1 |
46 |
5.9 |
69 |
7.1 |
195 |
8.1 |
78 |
6.1 |
126 |
5.9 |
|
October |
65 |
6.3 |
253 |
7.3 |
74 |
5.6 |
76 |
6.6 |
120 |
7.3 |
161 |
7.8 |
57 |
5.1 |
117 |
5.8 |
|
November |
58 |
6.8 |
311 |
7.2 |
75 |
5.8 |
86 |
6.8 |
86 |
7.4 |
172 |
7.6 |
39 |
4.5 |
108 |
6.5 |
|
December |
28 |
6.5 |
329 |
6.9 |
73 |
6.3 |
65 |
6.0 |
73 |
6.0 |
208 |
7.5 |
22 |
4.6 |
129 |
5.8 |
|
Annual (mean) |
45 |
6.0 |
273 |
6.6 |
59 |
5.8 |
57 |
6.5 |
86 |
7.7 |
173 |
8.0 |
62 |
5.2 |
147 |
5.4 |
Walvis Bay (Pelican Point)
|
Air Temperature (Deg C) |
Precipitation (mm) |
Air Pressure (hPa) |
|
|
January |
17.6 |
1 |
1011.3 |
|
February |
17.9 |
2 |
1010.5 |
|
March |
17.2 |
5 |
1011.1 |
|
April |
15.7 |
1 |
1012.3 |
|
May |
15.6 |
1 |
1014.2 |
|
June |
15.2 |
2 |
1016.8 |
|
July |
14.1 |
0 |
1017.2 |
|
August |
13.2 |
0 |
1017.1 |
|
September |
13.2 |
0 |
1015.7 |
|
October |
14.0 |
0 |
1014.5 |
|
November |
15.3 |
1 |
1013.6 |
|
December |
16.6 |
0 |
1012.0 |
|
Annual |
15.5 (mean) |
13 (total) |
1013.9 (mean) |
Wind data: Average direction frequency per thousand (N) and the average speed (V = m/s) for each of the eight main directions.
|
N |
NE |
E |
SE |
S |
SW |
W |
NW |
|||||||||
|
N |
V |
N |
V |
N |
V |
N |
V |
N |
V |
N |
V |
N |
V |
N |
V |
|
|
January |
33 |
4.2 |
16 |
2.3 |
3 |
1.3 |
29 |
2.2 |
164 |
5.0 |
323 |
5.2 |
140 |
2.8 |
127 |
3.7 |
|
February |
30 |
3.6 |
9 |
2.2 |
7 |
1.8 |
38 |
2.4 |
185 |
5.4 |
319 |
5.0 |
134 |
2.9 |
107 |
3.4 |
|
March |
25 |
3.9 |
11 |
1.9 |
6 |
1.8 |
55 |
3.6 |
234 |
6.0 |
335 |
5.8 |
95 |
2.7 |
68 |
2.8 |
|
April |
19 |
3.1 |
12 |
2.7 |
20 |
2.3 |
77 |
2.8 |
260 |
5.9 |
339 |
6.2 |
59 |
2.8 |
50 |
2.8 |
|
May |
21 |
3.4 |
36 |
3.8 |
35 |
3.0 |
101 |
3.1 |
275 |
5.8 |
269 |
5.6 |
51 |
3.1 |
50 |
2.8 |
|
June |
24 |
3.8 |
41 |
4.0 |
67 |
3.4 |
97 |
3.4 |
263 |
6.2 |
232 |
5.5 |
58 |
2.7 |
52 |
3.3 |
|
July |
35 |
4.1 |
37 |
3.3 |
42 |
3.1 |
95 |
3.4 |
254 |
6.5 |
259 |
6.3 |
50 |
2.6 |
56 |
3.1 |
|
August |
34 |
4.3 |
23 |
2.9 |
27 |
2.2 |
88 |
3.3 |
256 |
7.0 |
298 |
7.0 |
57 |
2.5 |
69 |
3.4 |
|
September |
44 |
4.1 |
20 |
2.6 |
21 |
1.8 |
82 |
3.4 |
215 |
7.0 |
308 |
7.3 |
75 |
3.3 |
85 |
3.2 |
|
October |
32 |
4.2 |
18 |
2.9 |
15 |
1.8 |
74 |
2.8 |
252 |
7.4 |
335 |
7.5 |
65 |
2.4 |
78 |
3.4 |
|
November |
40 |
4.3 |
16 |
2.4 |
11 |
1.9 |
46 |
3.0 |
192 |
6.1 |
340 |
6.5 |
92 |
2.7 |
116 |
3.4 |
|
December |
35 |
4.2 |
15 |
2.4 |
11 |
1.9 |
37 |
3.0 |
173 |
5.1 |
362 |
6.0 |
114 |
3.1 |
114 |
3.6 |
|
Annual (mean) |
31 |
4.0 |
21 |
3.1 |
22 |
2.6 |
68 |
3.1 |
227 |
6.2 |
310 |
6.2 |
83 |
2.8 |
81 |
3.3 |
Lüderitz (Diaz Point)
|
Air Temperature (Deg C) |
Precipitation (mm) |
Air Pressure (hPa) |
|
|
January |
17.7 |
1 |
1011.1 |
|
February |
17.8 |
2 |
1010.3 |
|
March |
17.4 |
3 |
1011.4 |
|
April |
16.3 |
2 |
1012.9 |
|
May |
15.5 |
2 |
1015.1 |
|
June |
15.1 |
3 |
1018.1 |
|
July |
14.1 |
2 |
1018.3 |
|
August |
13.7 |
2 |
1018.0 |
|
September |
13.9 |
1 |
1016.1 |
|
October |
14.7 |
1 |
1014.9 |
|
November |
15.8 |
0 |
1013.5 |
|
December |
17.0 |
1 |
1011.8 |
|
Annual |
15.7 (mean) |
20 (total) |
1014.3 (mean) |
Wind data: Average direction frequency per thousand (N) and the average speed (V = m/s) for each of the eight main directions.
|
N |
NE |
E |
SE |
S |
SW |
W |
NW |
|||||||||
|
N |
V |
N |
V |
N |
V |
N |
V |
N |
V |
N |
V |
N |
V |
N |
V |
|
|
January |
31 |
3.3 |
6 |
2.1 |
12 |
2.6 |
122 |
6.0 |
493 |
10.4 |
182 |
10.0 |
31 |
2.6 |
47 |
3.2 |
|
February |
26 |
3.7 |
3 |
3.1 |
9 |
2.5 |
141 |
6.0 |
441 |
9.8 |
192 |
8.4 |
42 |
3.0 |
59 |
3.6 |
|
March |
20 |
3.5 |
5 |
4.1 |
17 |
3.1 |
138 |
5.4 |
457 |
8.8 |
191 |
7.6 |
32 |
2.8 |
35 |
3.4 |
|
April |
39 |
3.5 |
9 |
4.1 |
30 |
3.1 |
139 |
5.6 |
396 |
7.0 |
169 |
6.4 |
30 |
2.8 |
56 |
3.7 |
|
May |
32 |
3.9 |
18 |
3.3 |
60 |
4.3 |
135 |
4.5 |
369 |
6.4 |
163 |
6.0 |
35 |
2.4 |
50 |
5.0 |
|
June |
45 |
4.8 |
40 |
4.5 |
90 |
5.3 |
136 |
4.7 |
290 |
6.1 |
143 |
5.4 |
35 |
2.8 |
69 |
4.3 |
|
July |
53 |
4.4 |
35 |
4.1 |
74 |
4.4 |
136 |
4.8 |
330 |
6.8 |
144 |
5.5 |
41 |
2.6 |
50 |
4.4 |
|
August |
52 |
4.8 |
25 |
3.9 |
49 |
4.5 |
148 |
5.9 |
375 |
8.4 |
150 |
6.7 |
39 |
2.4 |
71 |
4.8 |
|
September |
53 |
4.2 |
13 |
3.9 |
29 |
2.4 |
149 |
6.5 |
410 |
9.5 |
144 |
7.7 |
39 |
2.5 |
78 |
4.6 |
|
October |
45 |
4.1 |
11 |
2.9 |
19 |
3.4 |
150 |
6.8 |
453 |
10.4 |
141 |
8.2 |
41 |
2.2 |
69 |
4.1 |
|
November |
44 |
3.4 |
6 |
2.7 |
10 |
2.3 |
126 |
7.9 |
486 |
11.4 |
139 |
8.4 |
44 |
2.7 |
71 |
3.8 |
|
December |
31 |
3.2 |
6 |
2.6 |
18 |
6.0 |
123 |
6.4 |
498 |
10.8 |
161 |
9.8 |
43 |
3.8 |
60 |
3.4 |
|
Annual (mean) |
39 |
4.0 |
15 |
3.8 |
35 |
4.2 |
137 |
5.9 |
417 |
9.1 |
160 |
7.6 |
38 |
2.7 |
60 |
4.1 |