Data
- Obtaining
- Supplying
- High-Frequency
- Bottom Pressure Records
- Other Long Records
- GLOSS/ODINAFRICA Calibration Data
Donate
Donate to PSMSL
Data Notes
- Individual Station Data and Plot Notes
- Referencing the Data Set
- PSMSL Help File
- 2010 Changes to the PSMSL Data Files
Extracted from Database
11 Mar 2024
Station Information
| Station ID: | 312 |
| Latitude: | 68.428286 |
| Longitude: | 17.425759 |
| Coastline code: | 40 |
| Station code: | 81 |
| Country: | NORWAY |
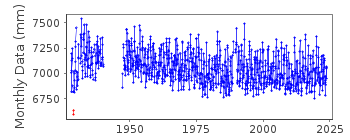
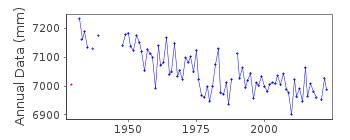
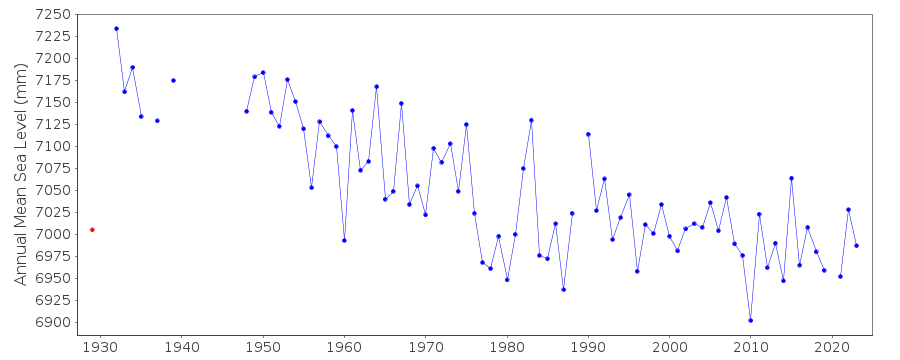
| Time span of data: | 1928 – 2023 |
| Completeness (%): | 89 |
| Date of last update: | 18 Jan 2024 |
| Green Arrow: | Current Station |
| Yellow Marker: | Neighbouring RLR Station |
| Red Marker: | Neighbouring Metric Station |
Please note: In many cases, the station position in our database is accurate to only one minute. Thus, the tide gauge may not appear to be on the coast.
Tide Gauge Data
Additional Data Sources (guide to additional data sources)
Nearby Real Time Stations from VLIZ: narvStation Documentation
Link to RLR information.Documentation added 1991-06-11
Narvik 040/081 RLR(1964) is 13.5m below BMN9N27Documentation added 1993-07-29
Values from November 1928 - February 1929 anomalously low (checked to be correct as received from authority).Documentation added 1995-03-30
Tide gauge network modernised, new equipment installed in 1989Documentation added 2009-01-28
Following the input of revised data values station made Metric awaiting datum information.Documentation added 2009-10-29
The Norwegian Mapping Authority have revised their datasets.Documentation added 2009-10-29
Whole dataset for Narvik now refers to TGBM N9 N28 8.881m above TGZ. A value for RLR 2008 was calculated. The RLR factor is now 5.119m add this value to data to refer to RLR (2008). RLR (2008) is 14.0m below TGBM N9 N28Documentation added 2012-09-05
For information on sea level change along the Norwegian coast see paper "Contributions to sea level variability along the Norwegian coast for 1960-2010" by K. Richter, J.E.O. Nilsen and H. Drange.Documentation added 2013-07-16
Data for 1928/9 had been flagged see comment above. However, taking the whole dataset only Jan/Feb 1929 look suspect.The rest of the flags have been removed.Data Authority
Norwegian Mapping AuthorityHydrographic Service
Po. Box 60
4001 Stavanger

![]()
![]()
![]()